In this article, Michael Maughan, Portfolio Manager of the Tyndall Australian Share Income Fund, discusses the impact on the big dividend payers from decarbonisation and where he sees opportunities for equity income investors.
Knowing where a company or industry is in its economic cycle, allows investors the ability to judge when to invest, and when to wait for a cheaper opportunity. This is because companies are subject to different economic cycles.
For example, the mining sector aligns more with Chinese growth than the US. Understanding Capex cycles—including the coming decarbonisation cycle—are relevant for dividend-focused investors due to the deployment of cashflows within those companies.
Where has the Australian market’s dividends come from historically?
First, we need to look at which sectors have yielded the highest dividends for investors.
Chart 1 shows that 37% of the yield over the past ten years has come from financials and materials. Not surprising given they are the largest sectors in the Australian market but perhaps surprising given mining companies often have a poor record in the capital discipline. That mix has changed over time, and those two sectors made up 56% of the yield in 2021.
Chart 1. 10 years of ASX200 dividends
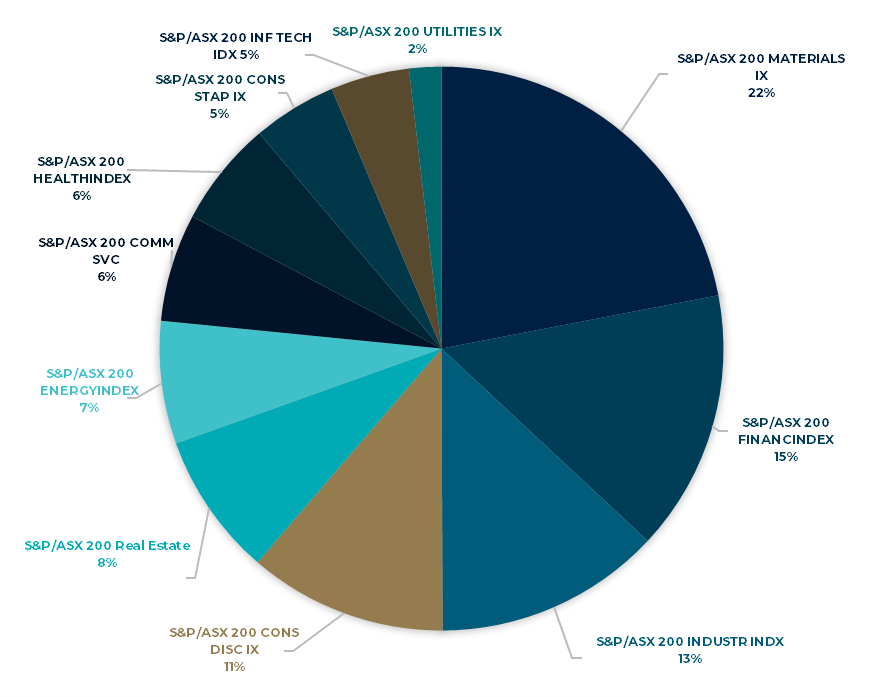
Banks have been consistent in their dividend payments except for a brief hiatus at the peak of COVID uncertainty. Materials have been more volatile with a big step down as China slowed and progressive dividend policies ceased in 2015/16, and a big step up in the past couple of years as commodity prices have boomed. However, going further back, the ability of miners to pay dividends was a function of the CAPEX they were spending and the prevailing commodity prices.
Over the past ten years, we have seen this trade-off between dividends and investment in energy names like Oil Search (now part of Santos) and Woodside. Oil Search prioritised LNG projects in PNG over dividend payments, and Woodside had a fluctuating dividend structure depending on its balance between producing assets and its LNG projects in WA.
As we discuss later in this piece, this balance could be changing.
So how could the energy transition impact big dividend payers’ ability to maintain dividends?
Decarbonisation is a capex cycle to play out over 20-30 years. Firstly, companies are decarbonising their operations. Secondly, globally we need to spend trillions of dollars on new nickel, lithium, copper, and cobalt mines to renewably electrify the world.
While this doesn’t sound great for dividends, the market has already factored much of this in. BHP and RIO Tinto have been explicit about the investments they are making to decarbonise their operations. BHP will increase capex by U$200 million p.a, for the next five years, and RIO Tinto will spend an extra U$500 million p.a. over the next three years.
The majority of this will go to renewable power generation in the Pilbara. Therefore, if there are extra costs of decarbonising operations (that may or may not be recovered in premium pricing), there is the capex opportunity to meet the demand created by the need for additional wires and batteries. Copper demand could double, and nickel demand could quadruple to meet Paris targets through ongoing electrification.
Net-net, this is a positive story for the diversified miners. Having growth opportunities to invest in that will generate cash and dividends in the future is much better than being a declining business with a high payout ratio. Share prices never assumed this level of cash flow was forever.
The banks have an opportunity to fund renewable projects through lending discussed by Brad Potter, Tyndall’s Head of Australian Equities, in his article: Banks funding renewables set to drive growth. Chart 2. shows that Westpac has been skewing away from fossil fuels towards renewables for 10 years already. Whether the Australian banks will be able to compete with the global interest to lend to these projects is unknown, but it is more opportunity than risk.
Chart 2. Westpac’s electricity generation lending over time and climate change solutions exposure
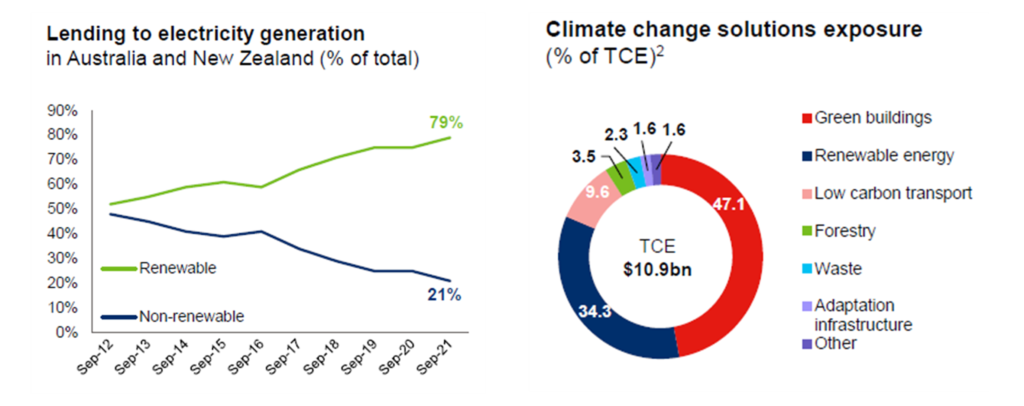
Source: The Westpac Group
Can dividends benefit from decarbonisation over the coming decades?
In the medium term, we expect that the traditional energy companies will be investing less capex, and concentrating on harvesting their current assets to facilitate the energy transition, meaning more cash being returned to shareholders through dividends and buybacks.
The mergers of Oil Search with Santos and Woodside with BHP petroleum create more balanced businesses with pristine balance sheets, strong cash flows, and a higher percentage of producing assets to fund growth opportunities or return cash to shareholders.
Interestingly, Macquarie is aggressively pursuing growth in both renewables and electricity infrastructure and have a model that develops assets on the balance sheet and then sells them down into funds in the same way the Goodman Group does for industrial property.
This focus has received a lot of attention and has been part of the stock’s rerating. However, they also have one of the world’s biggest energy trading businesses and therefore have been huge beneficiaries of the volatility in traditional energy markets.
The holy grail is a company that is exposed to the energy transition without necessarily being as capital intensive as a miner. One of the issues with the growth in renewables is that the transmission networks are not built for this decentralised generation structure.
We have lots of small producers, batteries that need electricity going in and out, and even household solar has changed the nature of the grid.
The result is that Australia need to add 10km of transmission lines to the existing 45km but current capacity to roll out is only 700m pa.
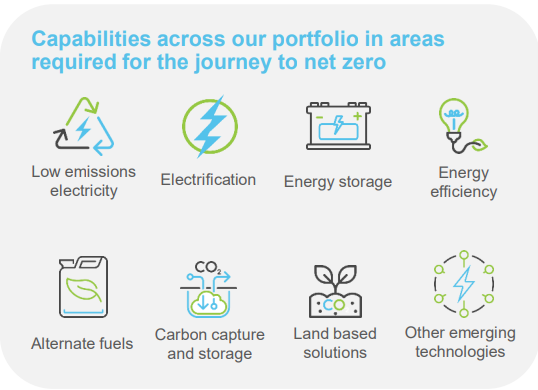
Downer Group is in a prime position to capitalize on this as highlighted in chart 3 as a leading player in electrical engineering and construction with 70 years’ experience. Worley is also growing the part of their business that consults with the hydrogen industry, although their core fossil fuels business has associated downside risks.
Chart 3. Downer capabilities leveraged to decarbonization
Conclusion
While we see a peak in capital returns from miners due to unprecedented supply/demand imbalances and low CAPEX pipelines, the expected increased investment in decarbonisation programs is unlikely to wipe out the traditionally high yield of the Australian equity market.
The tax structure still incentivises Australian companies to pay franked dividends, and the index composition is skewed to cash-generating companies.
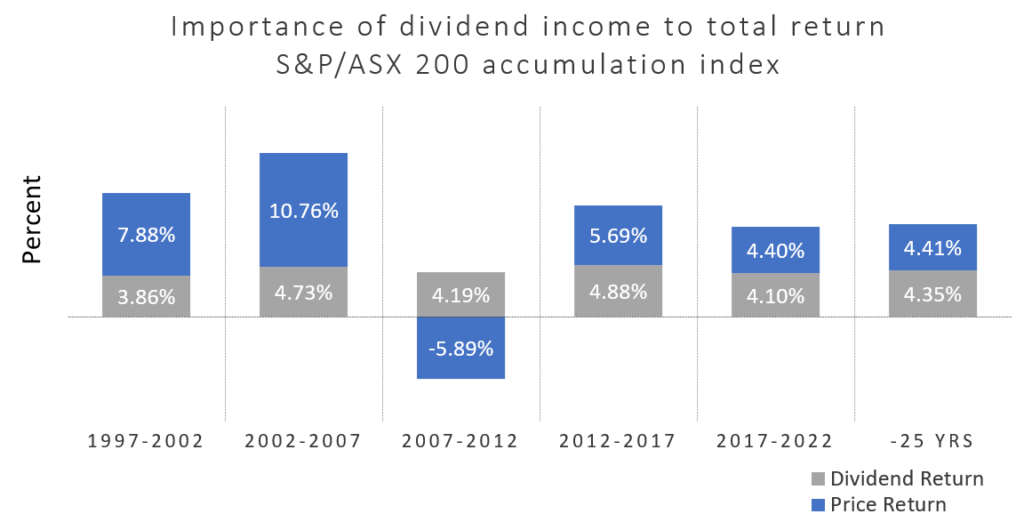
Over decades the Australian market has delivered net yields in the 4% range as shown in Chart 4 (5%+ grossed up for franking), and we don’t expect that to change materially in the future.
Chart 4. The importance of dividend income to total return
